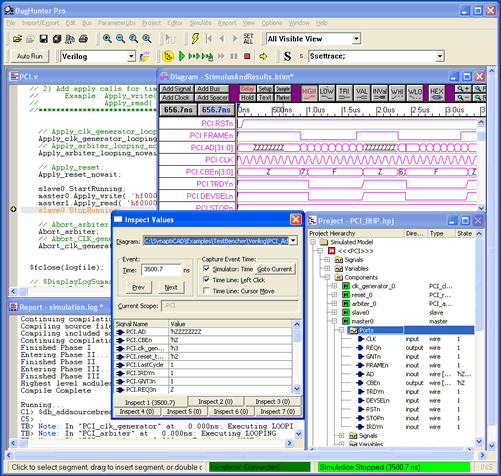
Graphical Debugging for Verilog, VHDL, and C++ simulators BugHunter uses the SynaptiCAD graphical environment and supports all major HDL simulators. It has the ability to launch the simulator, provide single step debugging, unit-level test bench generation, streaming of waveform data, project management, and a hierarchy tree. The unit-level test bench generation is unique in that it lets the user draw stimulus waveforms and then generates the stimulus model and wrapper code and launches the code. It is one of the fastest ways to test a model and make sure that everything is working correctly. The debugger also has exceptional support for VCD waveform files. With an integrated debugging environment you can graphically build a project, launch a simulation, and view the results in just a few minutes. The interface also manages the test bench interface so that it is easy to create a set of regression tests to run the design through.  Debugging Interfaces BugHunter Pro graphical debugging interfaces provide many different ways to view simulation results and track down errors: - Waveform window displays both the simulation results and the stimulus waveforms for the test bench generation.
- Project hierarchy displays entire design hierarchy and provides a quick way to access the HDL model code.
- Inspect Values window lets you view and set values of registers and signals. You can also view values at previous simulation times.
- Scope buttons, with the capitol S and lower case s, change the scoping level of the values in the Inspect Values window.
- Editor windows provide color-syntax highlighting for VHDL, Verilog, and C++ code.
- View values in Editor windows by placing the mouse button over signal or variable name in the code.
Debugging Features BugHunter Pro includes the most popular debugging features: - Time Break Points can be set through the Breakpoint tab in the Report window.
- Source Code Break Points can be set by clicking to the left of a line of source code in an Editor window. They can also be added through the Breakpoint tab in the Report window.
- Step Into with Trace button sends a message to the Simulation Log tab in the Report window after each step. This lets you quickly inspect the command that was just executed.
- Step Over button does do not step into a function or task but allows the simulation to continue until the next line after a function or task call.
- Break at Time Zero puts the simulator in an interactive mode after compile so that you can give the simulator commands before anything happens in the simulation. It is the equivalent of setting a breakpoint at time zero.
- Graphical Test Bench Generation for quickly testing small modules and doing bottom-up testing.
- Browse through the BugHunter Manual (web version) to get an idea of all of the different features
External Control Features BugHunter Pro has many features that let you control how it works with external tools: - Project Settings dialog sets the controls for external tools and simulators. It also provides multiple configurations for defining options for different machines, different simulators, and to create debug versus high-speed simulations.
- Define simulator settings for diagram-level simulations.
- Quick VCD file loading and true incremental signal loading.
- Stimulus & Results defines the current stimulus and results diagram, making it easy to switch in different sets of watched signals and unit-level test benches. Each diagram can be used to test a different aspect of your design. Once you have created stimulus and results diagram that you want to keep for regression testing you can save it to a Stimulus and Results Archive folder.
Available Options SynaptiCAD also has several other products and features sets that can be add on to BugHunter. - GigaWave option upgrades BugHunter so that is has the ability to view and edit very large simulation waveform files. This option uses several advanced waveform compression algorithms and a high-speed, binary waveform database that lets the program load, edit, and compare files that are 200 times bigger than can normally be handled on a given system.
- Reactive Test Bench Generation option upgrades BugHunter's stimulus based unit-level test bench generation, so that it can generate test benches with loops, reactive simulation-time tests and clocked based test benches.
- Timing Analysis option upgrades the BugHunter graphical interface so that delays, setups and holds will move and monitor waveform transitions effectively making the drawing window a full-fledged timing diagram editor.
Simulator Technical Details Currently BugHunter supports the following simulators: - Aldec ActiveHDL Verilog and VHDL
- Cadence VerilogXL, NC Verilog, NC VHDL (Incisive)
- Mentor ModelSim Verilog and VHDL (command line and GUI)
- SynaptiCAD VeriLogger Extreme and VeriLogger Pro
- Synopsys VCS
If you do not see your simulator, please contact SynaptiCAD and we can work with you to add additional support. At this time we support the following simulator control interfaces: PLI 1.0, PLI 2.0 (VPI), FLI (Foreign Language Interface), FMI (Foreign Model Import), CFC (C Function Call), and VDA (VHDL Design Access).
|

